
.png?width=268&name=images%20(1).png) Suppliers and Customers
Suppliers and Customers
Most Value Stream Maps have multiple suppliers and customers. Some have several hundred. You generally can’t put them all on a map, so you want to focus on the most important few.
I once worked with an aerospace supplier who could count their customers on one hand; in this case they were included individually on the VSM. Sometimes the scope is such that we have a single, internal customer. Other times, we have many customers which can be represented as a generic “Customers” or perhaps we consider the Warehouse or Distributors to be the customer…or a combination of these.
With suppliers, try to focus on the suppliers of items which are either: high cost, large (lots of floor space and / or difficult to move / manage), long or inconsistent lead times representative of the product’s “chassis” - something that everything else in the process gets attached to. Sometimes a VSM will have one supplier process box, other times it will have several. I’d suggest a maximum of 10, and most often less than 5 is appropriate. You don’t want to include commodity items like nuts, bolts, grease, etc. For example you may not want to include casters for a machine, but you may want to include $14,000 tires for heavy equipment. The supplier box on the VSM will generally flow to a raw material inventory icon which feeds a process. Some of the material used may not be at the beginning of the process flow, such as mounting wheels / tires toward the end of a process, and should be represented on the VSM as entering the flow at the process which consumes them.
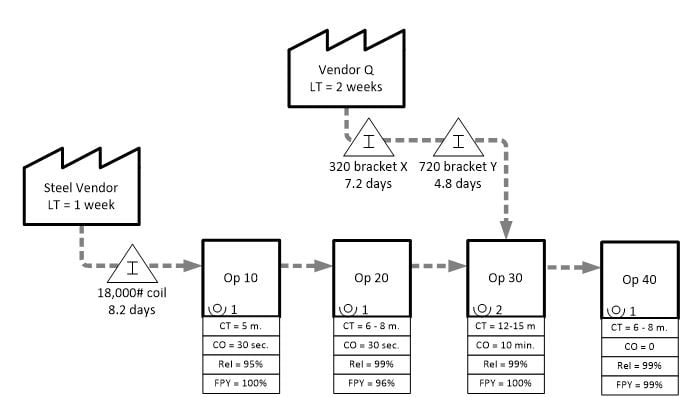
I like to add some information about suppliers and customers to the map. The following can add a lot of richness to our understanding of the performance of the VSM and current challenges / limitations we may have. For example, if I have 40 days of raw inventory whose supplier is in China and has a 16-week lead time, I understand why. Perhaps this could be changed or improved, but I understand the likely drivers behind the extra inventory. If my supplier is within 50 miles of my facility and has a 2-week lead time, good quality and reliable shipments, then 40 days of inventory raises other questions and highlights other opportunities.
Therefore, consider including the following Customer / Supplier information on your map:
Customer
Lead Time – I usually put their expected or required lead time as soon as a firm order is placed. Sometimes, this is a negotiated amount of time. Other times, I’ll hear “they usually want it tomorrow.” If your competitors can do that, then that should be the customer lead time used. If not, use the low end of what the industry can consistently do. This will guide us in the Future State to the right service level. If the customer would like a one-week lead time, but our best competitors can’t do less than 4 weeks, then 4 weeks will be a good target for the Future State. Less is better, but at what cost / trade-off? This information is good to have for that discussion. If they have a lot of rush orders (say 20%), you can note that.
On-Time Delivery – Is our on-time performance impeccable, great, good, mediocre, or poor? This may be a focus for the VSM. Do we measure on-time to their request or our promise date? We have to consider reasonableness of request dates and industry expectations.
Quality – Is quality to the customer 95%, 99% or 50 PPM? Although we’d always like our quality to be 100%, there are trade-offs to get there -more expensive materials, slower machine rates, more highly skilled employees, more mistake-proofing / inspection, etc. These things can raise costs, so we need to understand our current performance on quality vs. our customers’ expectations. Some customers are very happy with 99% quality. Others are looking for <100 PPM (>99.99%). If quality is an issue, then it will be a focus during the VSM exercise.
Order Pattern (Quantity, Frequency, Variability) – What quantities do they order and how frequently do they place orders (you may include this on the map)? What quantities and frequency would they like to have…or would we like to see (perhaps a discussion for Future State)? On the map, you may include the quantities they order and the frequency at which they order. This can lead to a Future State discussion around the quantity and frequency they’d like to have, or what we’d like to see.
Supplier
Lead Time – What is their lead time? Is it consistent, or does it vary? I’ve seen paint suppliers vary from next day to several weeks based on whether they had product in stock.
On-Time Delivery – Do they reliably meet their promised lead time?
Quality – Is it consistently excellent? Are there habitual issues -regular, relatively minor issues, which are accommodated without great pain? Or sporadic issues, such as getting in an entire shipment of non-conforming product, which either impacts production or requires a prohibitively high inventory to be held for such circumstances.
Order Pattern (Quantity, Frequency, Variability) – Can we order an individual piece, at a competitive price, or do we need to order a larger quantity? A case? Pallet? Truckload?
All these things help us understand why we have the raw material inventory we do (or don’t at times, but wish we had), and perhaps opportunities to improve it.
Stay tuned for part 4 of the VSM blog series to learn about the details of VSM effort – the event itself!
At the end of the series on Friday, you will receive the full VSM Guide e-book. The e-book will go into further details of a Value Stream Map, including:
- Shared vs. dedicated resources
- Representing inventory on the map
- Little’s law
- Mapping a high-mix process
- Identifying waste


